CSV uploader app
In this tutorial, we'll learn to build a simple app for exploratory data analysis. The app will let us upload CSV files and visualize the data distribution in a histogram, and we'll interact through selectors to choose the CSV file and column to be plotted. Take a look at the final app:
The full code and some sample CSV files can be downloaded from this GitHub repository.
Setup and app structure
We'll use GenieFramework.jl, DataFrames.jl and CSV.jl to build the
app. To install them, enter Pkg mode with ] and type in the following
command:
pkg> add GenieFramework DataFrames CSV PlotlyBase
The app's code will have a main file app.jl for the logic,
ui.jl for the UI, and a public/uploads folder to store the datasets:
CSVAnalysis
├── app.jl
├── ui.jl
└── public/uploads/
Implementation
Let's start by opening the app.jl file and adding the
following skeleton code:
using GenieFramework, DataFrames, CSV, PlotlyBase
@genietools

@app
# Logic goes here
end

@page("/", "ui.jl")
The @genietools macro sets up the Genie environment and the @page
macro renders the app's UI, whereas the logic will be implemented in
between. For the ui.jl file this will be the skeleton code:
 heading("CSV Analysis")
 row([ ])
 row([ ])
 row([ ])
The app has four components: an upload box, two selectors, and a histogram plot. To implement each component, we'll need to:
- Define component's UI in
ui.jl. - Define the necessary variables and expose them to the UI.
- Implement the component's behavior.
Upload box
The upload box lets us select a .csv file and store it on the server
side. Add one to the page by editing ui.jl as follows:
 heading("CSV Analysis")
 row([
      cell(class="col-md-12",
          [
          uploader( multiple = true,
              accept = ".csv",
              maxfilesize = 1024*1024*1, # bytes
              maxfiles = 3,
              autoupload = true,
              hideuploadbtn = true,
              label = "Upload datasets",
              nothumbnails = true,
              style="max-width: 95%; width: 95%; margin: 0 auto;",

              @on("rejected", :rejected),
              @on("uploaded", :uploaded)
              )

          ])
 ])
. . .
The uploader component takes many parameters to control its behavior, see its docstring for more information. It also emits several events when actions are performed which can be intercepted in the backend; we'll use the uploaded and rejected events to notify the user when the upload is finished or if the file is invalid.
When a file is uploaded, it is stored in a temporary folder in the server. The path to this file, and other information, is stored in the reactive variable fileuploads. This variable is automatically created when the user loads the page. We'll attach a handler to fileuploads in order to manage the files. Add the following to the @app block in app.jl:
const FILE_PATH = joinpath("public", "uploads")
mkpath(FILE_PATH)
@app begin
    @out upfiles = readdir(FILE_PATH)
    @onchange fileuploads begin
        if ! isempty(fileuploads)
            @info "File was uploaded: " fileuploads
            filename = fileuploads["name"]

            try
                isdir(FILE_PATH) || mkpath(FILE_PATH)
                mv(fileuploads["path"], joinpath(FILE_PATH, filename), force=true)
            catch e
                @error "Error processing file: $e"
                notify(__model__,"Error processing file: $(fileuploads["name"])")
            end

            fileuploads = Dict{AbstractString,AbstractString}()
        end
        upfiles = readdir(FILE_PATH)
    end
    @event uploaded begin
        @info "uploaded"
        notify(__model__, "File was uploaded")
    end
    @event rejected begin
        @info "rejected"
        notify(__model__, "Please upload a valid file")
    end
end
When activated, the handler will move the uploaded file from its temporary location to FILE_PATH and notify the user. The __model__ passed to notify is the reactive model of the app, which maintains a representation of the reactive elements in the app. We've also added the upfiles variable to store the list of uploaded files, which will then be used to populate the file selector. Finally, the @event macro defines handlers for the received events.
With this, you can already run your app to test it as
using GenieFramework; Genie.loadapp(); up()
This will start a server and you can access the app at localhost:8000.
File and column selectors
Once we have uploaded a .csv file , we want to access its contents and
choose one column for plotting. We'll do the choosing through two
selectors, which you can add to the second row in ui.jl as
row([
     cell(
          class="st-module",
          [
           h6("File")
           Stipple.select(:selected_file; options=:upfiles)
          ]
         )
     cell(
          class="st-module",
          [
           h6("Column")
           Stipple.select(:selected_column; options=:columns)
          ]
         )
    ])
The selectors are generated by Stipple.select, which takes as first
argument the symbol name of the variable where the selected value will
be stored.
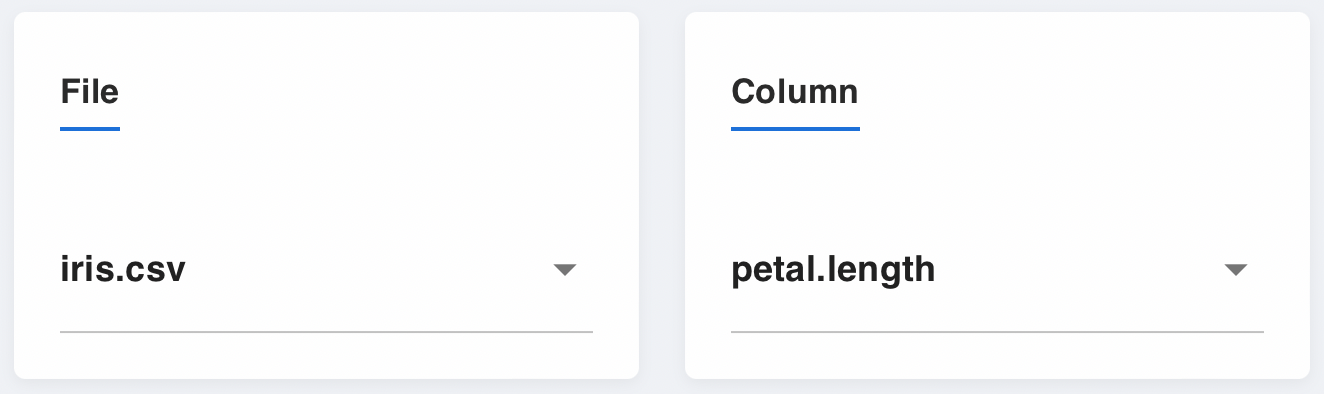
Assuming the app comes with the Iris dataset preloaded, define now the reactive variables for each selector with default values as:
@in selected_file = "iris.csv"
@in selected_column = "petal.length"
@out upfiles = readdir(FILE_PATH)
@out columns = ["petal.length", "petal.width", "sepal.length", "sepal.width", "variety"]
Note that we tag the selection variables with @in as they'll be
storing values sent from the UI.
When a new file is selected, the dataset must is loaded into memory and the list of columns that can be plotted updated. First, add a new private variable to store the dataset:
@private data = DataFrame()
This variable is tagged with @private since each user needs to have its own copy, but the variale doesn't need to be sent to the browser.
Now, add a handler to load the data and column list when the file selector changes:
    @onchange isready,selected_file begin
        data = CSV.read(joinpath(FILE_PATH, selected_file), DataFrame)
        columns = names(data)
    end
We've also attached the handler to the isready variable, which becomes true when the page is finished loading, so that we won't start with an empty page with no selection.
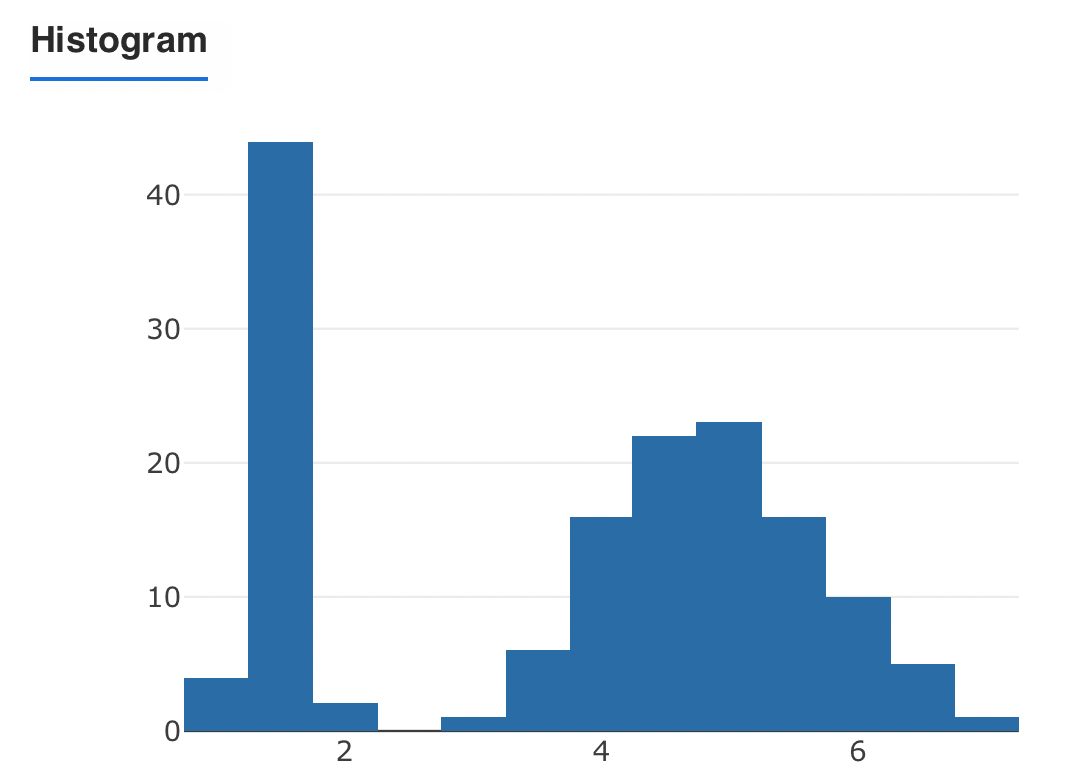
Histogram
After selecting a dataset, we want to plot a histogram of one of its plots every time we make a new selection with the column selector. Genie uses Plotly for plots, which requires a trace to store the data on the plot, and a layout to define the plot's aesthetics. See the plotting reference for more info.
Add the trace and layout via reactive variables as:
    @out trace = [histogram()]
    @out layout = PlotlyBase.Layout(yaxis_title_text="Count",xaxis_title_text="Value")
The PlotlyBase prefix is necessary to avoid clashes with GenieFramework.Layout.
Then, add a handler to update the trace when the column selector changes:
    @onchange isready, selected_column begin
        trace = [histogram(x=data[!, selected_column])]
    end
Finally, add the plot to the last row in ui.jl as:
row([
     cell(
          class="st-module",
          [
           h5("Histogram")
           plot(:trace, layout=:layout)
          ]
         )
    ])
That's it, we're done! Now you can run the full app and add some more functionality if you'd like. Here are some ideas:
- Add a scatter plot.
- Add other interactive elements such as sliders to change the parameters of the plot.
- Add the clustering algorithm from the Iris tutorial and try it on different datasets.