Genie Builder 1.0 quick start
Once the extension is installed, you'll see a new button in the bottom bar of the IDE that reads "GB stopped". Click it to run Genie Builder.


After a moment, the button will change to "GB running", and you'll see the new GENIE tab in the left sidebar.

Next, create a new app by clicking on the "Create Genie app" button the GENIE tab. You'll be prompted to name your app and enter a path to save it. After a few moments, the app will be created and loaded, with the main window displaying the visual UI editor. See the Troubleshooting page if you're having issues launching Genie Builder.
Read on to create your first app, or watch the video below for a quick introduction.
App development workflow
This guide will lead you through the essential steps in building an app that generates a vector of random numbers and displays its statistics and a histogram.

By default, a new app comes with two files:
app.jlwhere the logic resides, andapp.jl.htmlwhich defines the UI.
You'll manually edit app.jl and other files in the workspace, whereas app.jl.html can be edited via the no-code editor. An app is usually developed in three steps:
- Import Julia code: bring your existing Julia code into the app.
- Build the UI: create the UI with the necessary components to interact with your code.
- Implement the logic: write the reactive code that will make the UI interactive.
- Deploy the app: deploy on JuliaHub in one click or deploy to your infrastructure with a Docker container.
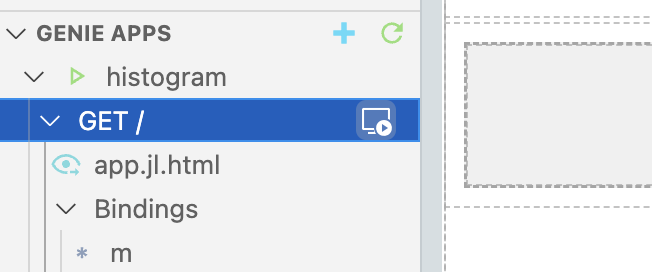
To preview an in-development app, click on the icon next to the GET tab. This will open a new tab with your app rendered. You can also open a preview in a new browser tab by right clicking instead.
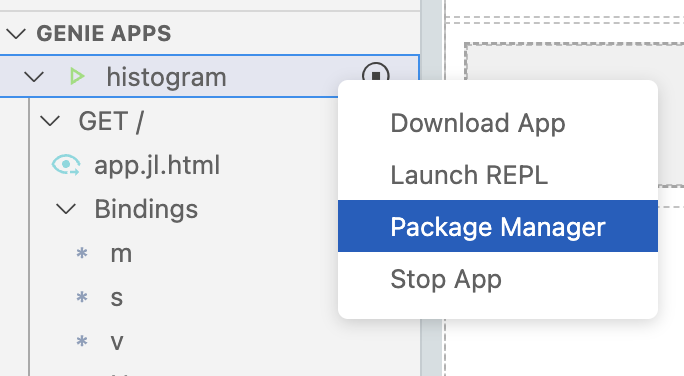
Genie Builder automatically reloads code files when they are edited, so if any package is missing an error will be thrown. To avoid this, first install any packages you might need using the builtin package manager. For this example, you'll need to install StatsBase.

1. Import Julia code
The app.jl file comes with a basic skeleton for your app. The block delimited by the @app macro will hold the reactive code, and @page macro defines a route and the file that will be rendered in the browser when this route is visited.
You can add your Julia code directly in app.jl before the @app. In this example, we're adding a simple statistics function which requires the StatsBase package:
module App
using StatsBase: mean, std, var
using GenieFramework, PlotlyBase
@genietools

function statistics(x)
  mean(x), std(x), var(x)
end

@app begin
    # reactive code goes here
end

@page("/", "app.jl.html")
end
In the future, you can import code by creating a lib folder in the app workspace and placing your Julia files inside of it. Any code placed in lib will be automatically loaded and available to call from app.jl
2. Build the UI
Launch the no-code editor by clicking on the eye icon in the left sidebar,
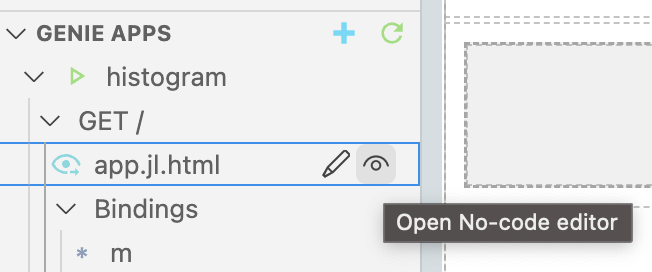
and start building the UI by dragging UI components onto the canvas. You will need:
- A header, a two-column row, and a one-column row for the layout.
- A H6 heading for the slider.
- A slider, three big numbers, and a histogram chart to control and display the statistics.
When you select a component in the canvas, its configuration options will open in the right sidebar. Here you can set the component's data bindings, and other properties to control its behavior. We won't touch the bindings for now, but feel free to play with the available properties.
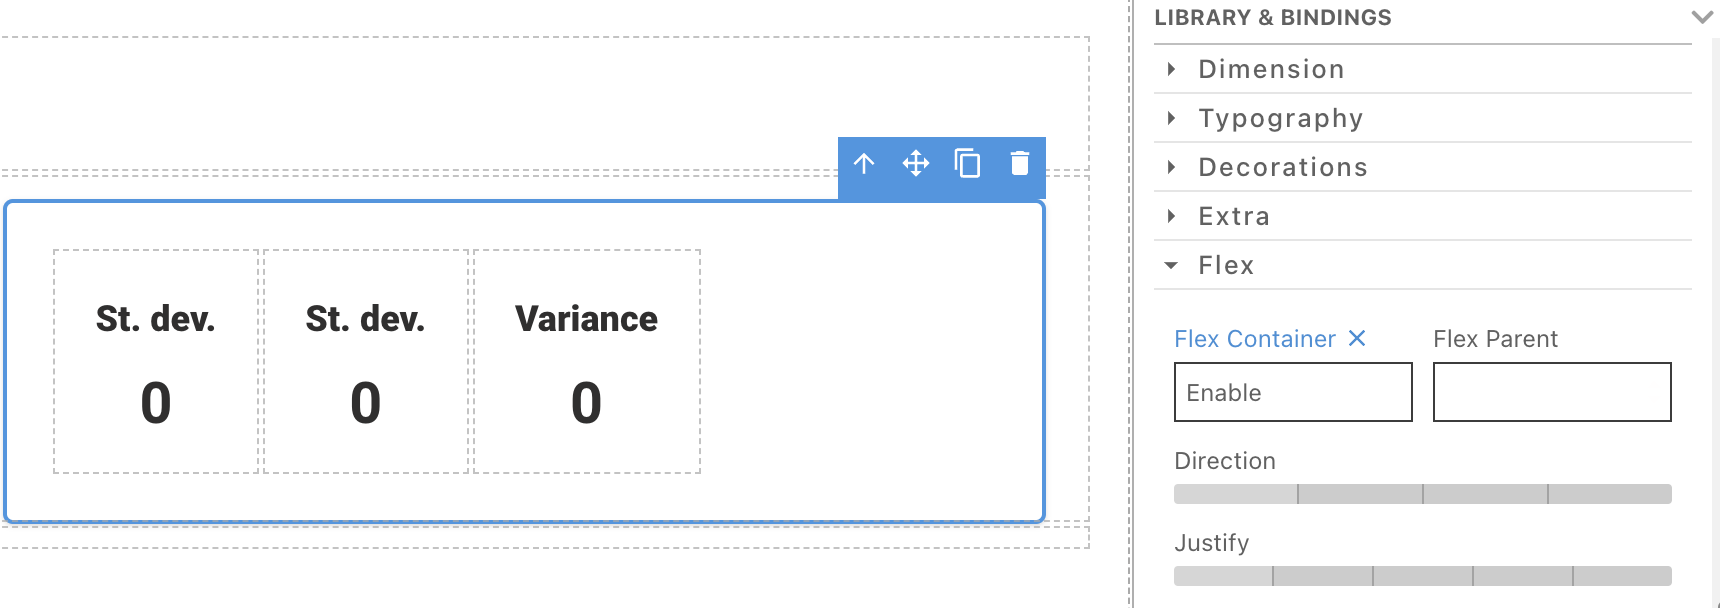
To make the big numbers appear side by side instead of in a column, select the parent container, go to the style tab, and enable its Flex Container property.
To learn more about the features provided by the visual editor, see its dedicated documentation.
3. Implement the app's logic
Interactive components like the slider, or those displaying dynamic information like the big numbers, require variables in the Julia code to hold their state and communicate its value to the front end. For our example we'll need:
- A number
Nto store the vector length selected in the slider. - A vector
xthat contains the random numbers for the statistics and histogram. - Three numbers,
m,s, andvto hold the statistics displayed in the big numbers.
We also want to generate a new vector when slider is moved, and update the statistics. This interactivity is implemented with reactive code formed by a set of reactive variables and a set of reactive handlers.
Reactive variables
Reactive variables are variables that monitor their own value and, when a change in it occurs, an update notification is set to the connected parts of the app. They are declared with the @in and @out macros, where
@indenotes a read-write variable whose value can be changed from the browser and from the Julia code running in the backend, and@outdenotes a read-only variable that can only be changed in the backend.
Add the following code to the @app block in app.jl to declare the variables for the example:
@app begin
  @in N = 0
  @out x = randn(10)
  @out m::Float32 = 0.0
  @out s::Float32 = 0.0
  @out v::Float32 = 0.0
end
Note that you cannot initialize a reactive variable with another. For instance, having @out x = randn(N) will throw an error.
Reactive handlers
Reactive handlers are defined with the @onchange macro and set to watch one or more reactive variables. When their value changes, a code snippet is executed. Add the following handler to the @app block to update of the vector statistics when N changes:
@app begin
  . . .
  @onchange N begin
    x_rand = randn(N)
    m, s, v = statistics(x_rand)
  end
end
end
@in or @out can only be modified within a block delimited by the @onchange macro. Any changes made outside of it will not be reflected in the UI.Binding components to reactive variables
While the reactive code is already defined, the UI won't do anything when the slider is moved. This is because the components aren't bound to a reactive variable yet.
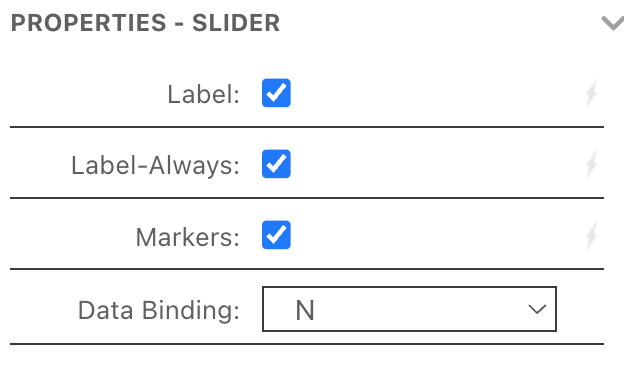
Now, attach each big number and the slider to their corresponding variable via their Data Binding field in the no-code editor.
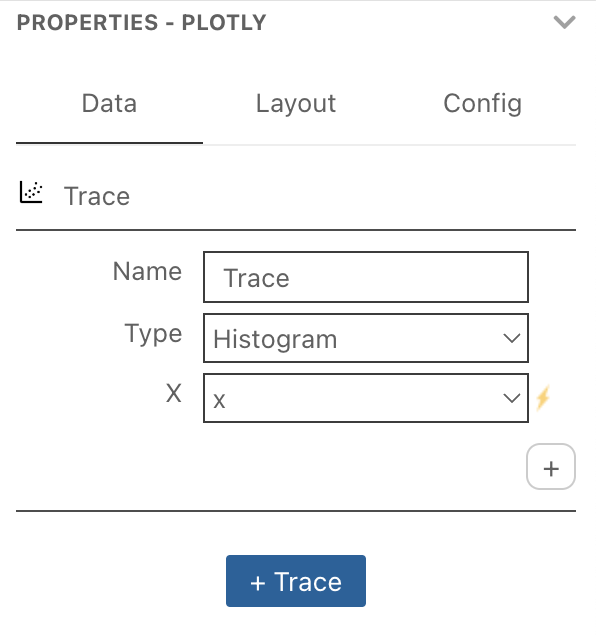
For plots, Genie Builder provides a comprehensive editor that lets you add and configure multiple traces, and set the plot layout. Select the chart, and add a new histogram trace.
With this, you'll have a working interactive app. It's time to deploy!
app.jl
+app.jl.html
+4. Deploy the app
You can deploy the app from the JuliaHub projects page as explained here. You can also follow this guide to containerize your app with Docker and deploy it online.